Showing posts with label Maps. Show all posts

Thursday, April 2, 2015

You"ve Got To Try The Pac-Man Google Maps Game

Everyone loves playing the classic PAC-MAN arcade game, and now you can do just that — in your own neighborhood — using Google Maps.


On Your Desktop


pacman


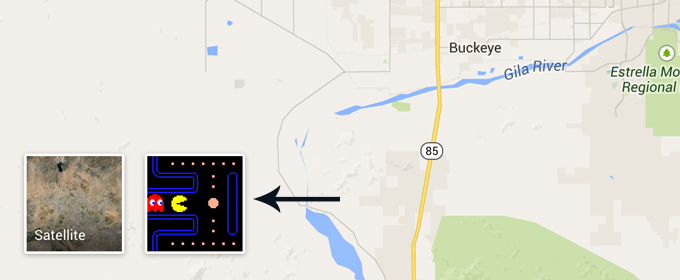
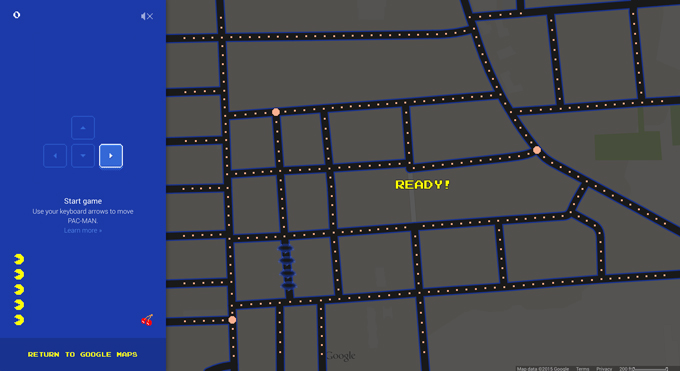
Go to maps.google.com, and look in the bottom left corner. There should be a little square there with a shot of a PAC-MAN game. While hovering over it, you’ll see a square appear in the center of the map that reads, “Ready!” Click on the PAC-MAN square and you’re off to the races — probably.


pacman


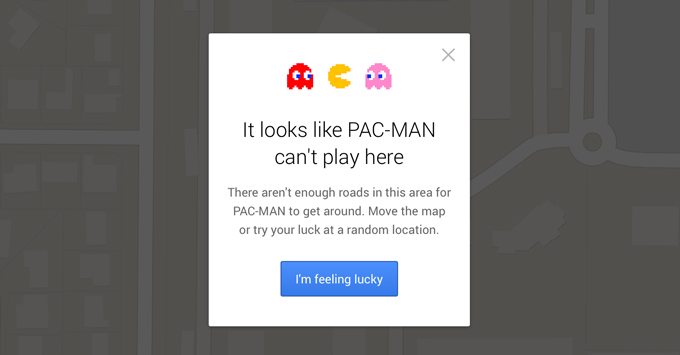
The game doesn’t work with every neighborhood, mostly because some don’t have enough streets. When it does work, it’s a ton of fun. Just use your arrow keys to get around and enjoy!


pacman


On Your Phone


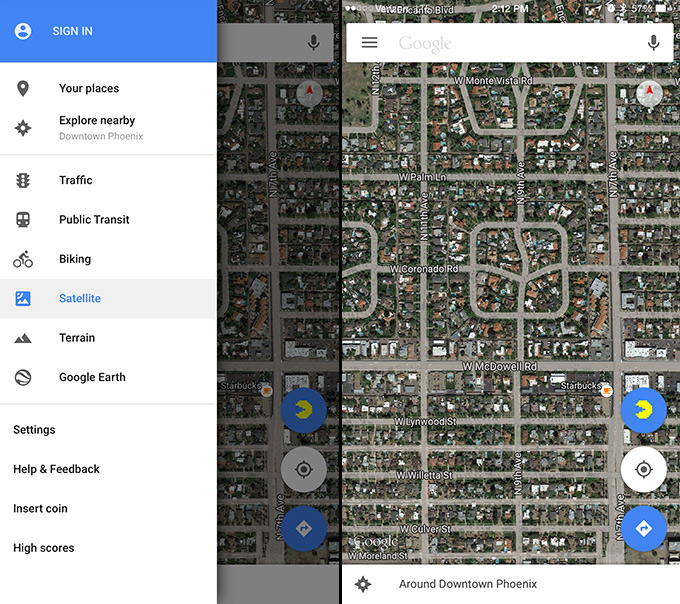
If you have the Google Maps app on either your iPhone or Android device, you can do the same thing. Tap the three lines in the upper left-hand corner, then select “Insert Coin.”


Pac-Man on Google Maps


This is where things get cryptic.


You’re now taken to a page that reads, “Play PAC-MAN in Google Maps,” that gives you clues to locations on the map where you can play the game. Most of them are pretty hard to figure out, but one I nailed right away because I happen to live there.


Go to Phoenix, Arizona, and the intersection of W. McDowell Road and N. 7th Ave (it’s just north of Downtown). Play with your zoom a little bit, and the blue and yellow PAC-MAN symbol will pop up on the right-hand side. Press that and you can now swipe away to your heart’s content.


This is likely all in honor of April Fool’s Day, so your time is limited. But in the meantime, get after it and start playing PAC-MAN in your neighborhood!


Kevin Whipps is a writer and editor based in Phoenix, Arizona. When he’s not working on one of the many projects in his queue, he’s looking for fun and irreverent things online to share with his friends.
You"ve Got To Try The Pac-Man Google Maps Game

Friday, March 6, 2015

13 JavaScript Libraries to Create Interactive & Customized Maps

We previously featured Google Map Maker and 10 other tools to help you build maps. However, if you prefer using Javascript libraries instead, have we got the post for you. Here are the JS libraries you can use to show special map markers, draw custom route lines or even show a dialog when you hover or click on certain points of the map.


Personalize your maps in the style that you want — some of them can be styled with CSS — or customize your map to be as interactive as you like. The source of the map data, dependencies and licenses of each library has been included for your convenience.


More on Hongkiat:


GMaps


GMaps makes adding and customizing Google Maps a breeze. Aside of adding a map, you can also a couple of things into the map, such as polylines which may be useful for drawing a route, a special menu control, and even HTML elements.


GMaps is compatible with JSON formatted data which you can utilize to integrate your map with a particular app, like Foursquare.


  • Map Data Source: Google Maps

  • Dependencies: none

  • License: MIT License


jHere


At 5KB, jHERE shows you that size doesn’t matter; you can still build a powerful interactive map with a handful of customization options. jHERE derives map visualization from HERE map, which is one of the most popular map providers for Windows Phone.


The library can be extended with new functionality, and there are a couple of extensions developed for this library including one for adding shapes, routes, and custom markers.


  • Map Data Source: HERE Maps

  • Dependencies: jQuery or ZeptoJS

  • License: MIT License


Kartograph


Kartograph comprises of two files, Kartograph.ph to generate the map in SVG format, and Kartograph.js to add interactive elements on top of the map. Since Kartograph.js is built on top of Raphael.js the map would work nicely down to IE7. You can have a look at the interactive map demos to discover what Kartograph can do.


  • Map Data Source: Kartograph

  • Dependencies: Kartograph.py, Raphael, and jQuery

  • License: AGPL and LGPL


Mapael


jQuery Mapael allows you to create maps with elegant data visualization as well as interactivity. You can, for example, create a map and designate each region on the map with different colors based on region. You can also add tooltip on the region, as well as event handlers like click or hover.


The map is built with SEO in mind by providing alternate content for search engine robots that are not capable of crawling JavaScript-generated content.


  • Map Data Source: Raphael.js

  • Dependencies: jQuery

  • License: MIT License


D3js


D3.js is a comprehensive JavaScript library that will bring your data to life through HTML, SVG and CSS. D3 use is quite varied including for building a highly interactive map. See this map of World Bank Global Development and you will see the possibilities of what you can build with D3.js.


  • Map Data Source: D3.js

  • Dependencies: none

  • License: Undefined


DataMaps


If building a map with D3.js is overwhelming, you can use DataMaps. DataMaps is essentially a D3.js plugin that is developed specially to build maps. It inherits many of the capability of D3.js, hence you can build simple or very customized maps with it. Did I mention that the map is responsive?


  • Map Data Source: D3.js

  • Dependencies: D3.js and TopoJSON

  • License: MIT License


GeoChart


GeoChart is a simplified Google Map that renders region, markers, and text, instead of a full-fledged map with tiny details. The map is generated in SVG, and can be customized in many ways including changing the region colors, adding popup, and custom map markers.


  • Map Data Source: Google Maps

  • Dependencies: none

  • License: Read Google Maps TOS


Maplace


Maplace, a jQuery plugin for generating map through the Google Maps API v3. Maplace works in all browsers, including IE6. So this is another great plugin worth of your attention if you want to build map in the easiest way possible.


  • Map Data Source: Google Maps

  • Dependencies: jQuery

  • License: MIT License


Stately


Stately is JavaScript library that is developed to generate US maps. The library is comparably lightweight considering that you can add interactive elements on top of your generated maps.


  • Map Data Source: Stately / SVG

  • Dependencies: none

  • License: MIT License


GeoComplete


GeoComplete is a distinct JavaScript library on its own. The library will add an input field along with the map, which will show suggestions of cities, countries or states as you type.


  • Map Data Source: Google Maps

  • Dependencies: jQuery

  • License: MIT License


Map Tools


Map Tools provides intuitive API to add Google Maps. It supports loading of geo-formatted JSON data such as TopoJSON and GeoJSON to render the map. On top of that, you can add animated markers that I think will make the map more lively, insert HTML content with variables or placeholders ala Handlebars.


  • Map Data Source: Google Maps

  • Dependencies: GeoJSON / TopoJSON

  • License: MIT License


OpenLayers


OpenLayers is a high performance open source JavaScript framework to build interactive maps using various mapping services. You can choose the map layer source using tiled layer or vector layer from a number of map services.


OpenLayer come mobile ready out of the box, suitable for building maps across devices and browsers. You can use CSS for a different look of your map. To implement the map in your web using OpenLayers, here’s a tutorial that will help.


  • Map Data Source: OpenStreetMap

  • Dependencies: none

  • License: Undefined


Leaflet


Developers gave Leaflet basic functions to work perfectly, keeping its size small, perfect for mobile devices. For specific functions, just extend Leaflet using plugins. Leaflet has most online map features you need: tile layers, popup, markers, and free vector layers like polylines, polygons, circles or rectangles. It comes with nice default designs although you can customize the style using CSS3 with ease.


Leaflet has the most usage interaction features both for mobile and desktop browsers.


  • Map Data Source: OpenStreetMap

  • Dependencies: none

  • License: Undefined


13 JavaScript Libraries to Create Interactive & Customized Maps

13 JavaScript Libraries to Create Interactive & Customized Maps

We previously featured Google Map Maker and 10 other tools to help you build maps. However, if you prefer using Javascript libraries instead, have we got the post for you. Here are the JS libraries you can use to show special map markers, draw custom route lines or even show a dialog when you hover or click on certain points of the map.


Personalize your maps in the style that you want — some of them can be styled with CSS — or customize your map to be as interactive as you like. The source of the map data, dependencies and licenses of each library has been included for your convenience.


More on Hongkiat:


GMaps


GMaps makes adding and customizing Google Maps a breeze. Aside of adding a map, you can also a couple of things into the map, such as polylines which may be useful for drawing a route, a special menu control, and even HTML elements.


GMaps is compatible with JSON formatted data which you can utilize to integrate your map with a particular app, like Foursquare.


  • Map Data Source: Google Maps

  • Dependencies: none

  • License: MIT License


jHere


At 5KB, jHERE shows you that size doesn’t matter; you can still build a powerful interactive map with a handful of customization options. jHERE derives map visualization from HERE map, which is one of the most popular map providers for Windows Phone.


The library can be extended with new functionality, and there are a couple of extensions developed for this library including one for adding shapes, routes, and custom markers.


  • Map Data Source: HERE Maps

  • Dependencies: jQuery or ZeptoJS

  • License: MIT License


Kartograph


Kartograph comprises of two files, Kartograph.ph to generate the map in SVG format, and Kartograph.js to add interactive elements on top of the map. Since Kartograph.js is built on top of Raphael.js the map would work nicely down to IE7. You can have a look at the interactive map demos to discover what Kartograph can do.


  • Map Data Source: Kartograph

  • Dependencies: Kartograph.py, Raphael, and jQuery

  • License: AGPL and LGPL


Mapael


jQuery Mapael allows you to create maps with elegant data visualization as well as interactivity. You can, for example, create a map and designate each region on the map with different colors based on region. You can also add tooltip on the region, as well as event handlers like click or hover.


The map is built with SEO in mind by providing alternate content for search engine robots that are not capable of crawling JavaScript-generated content.


  • Map Data Source: Raphael.js

  • Dependencies: jQuery

  • License: MIT License


D3js


D3.js is a comprehensive JavaScript library that will bring your data to life through HTML, SVG and CSS. D3 use is quite varied including for building a highly interactive map. See this map of World Bank Global Development and you will see the possibilities of what you can build with D3.js.


  • Map Data Source: D3.js

  • Dependencies: none

  • License: Undefined


DataMaps


If building a map with D3.js is overwhelming, you can use DataMaps. DataMaps is essentially a D3.js plugin that is developed specially to build maps. It inherits many of the capability of D3.js, hence you can build simple or very customized maps with it. Did I mention that the map is responsive?


  • Map Data Source: D3.js

  • Dependencies: D3.js and TopoJSON

  • License: MIT License


GeoChart


GeoChart is a simplified Google Map that renders region, markers, and text, instead of a full-fledged map with tiny details. The map is generated in SVG, and can be customized in many ways including changing the region colors, adding popup, and custom map markers.


  • Map Data Source: Google Maps

  • Dependencies: none

  • License: Read Google Maps TOS


Maplace


Maplace, a jQuery plugin for generating map through the Google Maps API v3. Maplace works in all browsers, including IE6. So this is another great plugin worth of your attention if you want to build map in the easiest way possible.


  • Map Data Source: Google Maps

  • Dependencies: jQuery

  • License: MIT License


Stately


Stately is JavaScript library that is developed to generate US maps. The library is comparably lightweight considering that you can add interactive elements on top of your generated maps.


  • Map Data Source: Stately / SVG

  • Dependencies: none

  • License: MIT License


GeoComplete


GeoComplete is a distinct JavaScript library on its own. The library will add an input field along with the map, which will show suggestions of cities, countries or states as you type.


  • Map Data Source: Google Maps

  • Dependencies: jQuery

  • License: MIT License


Map Tools


Map Tools provides intuitive API to add Google Maps. It supports loading of geo-formatted JSON data such as TopoJSON and GeoJSON to render the map. On top of that, you can add animated markers that I think will make the map more lively, insert HTML content with variables or placeholders ala Handlebars.


  • Map Data Source: Google Maps

  • Dependencies: GeoJSON / TopoJSON

  • License: MIT License


OpenLayers


OpenLayers is a high performance open source JavaScript framework to build interactive maps using various mapping services. You can choose the map layer source using tiled layer or vector layer from a number of map services.


OpenLayer come mobile ready out of the box, suitable for building maps across devices and browsers. You can use CSS for a different look of your map. To implement the map in your web using OpenLayers, here’s a tutorial that will help.


  • Map Data Source: OpenStreetMap

  • Dependencies: none

  • License: Undefined


Leaflet


Developers gave Leaflet basic functions to work perfectly, keeping its size small, perfect for mobile devices. For specific functions, just extend Leaflet using plugins. Leaflet has most online map features you need: tile layers, popup, markers, and free vector layers like polylines, polygons, circles or rectangles. It comes with nice default designs although you can customize the style using CSS3 with ease.


Leaflet has the most usage interaction features both for mobile and desktop browsers.


  • Map Data Source: OpenStreetMap

  • Dependencies: none

  • License: Undefined


13 JavaScript Libraries to Create Interactive & Customized Maps

Friday, February 27, 2015

GIFtorial: How To Use Displacement Maps in Photoshop

In this tutorial, you’ll learn how to use Photoshop Displacement Maps to distort graphics so that they realistically match the background you’re applying them to. To make sure things are easy to follow along with, I’ll use animated GIFs for each step.


What’s a Displacement Map?


A Displacement Map is a way of automatically distorting a layer using pixel data from another document. Displacement Maps can take what would be slow, grueling hours of manual distortion work and turn it into a relatively quick and simple task.


Here’s the result we’ll be creating:


giftorial


Where most designers would toss in the bear graphic, set it to Multiply, and call it a day, we’re going the extra mile by making sure the bear graphic is distorted to match the cracks and crevices of our wall texture. Pretty cool!


giftorial


Resources


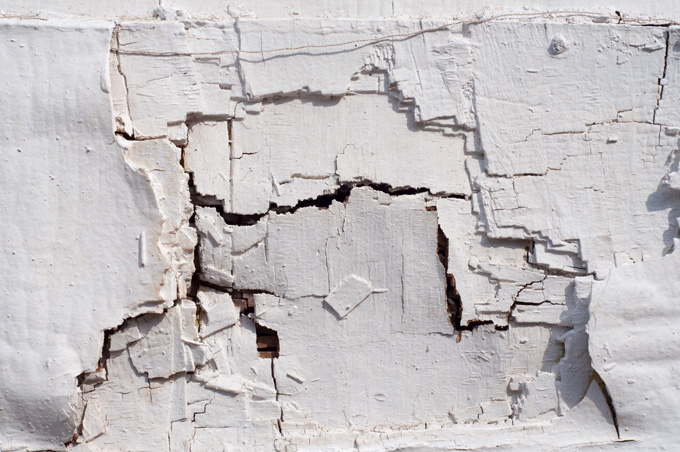
All you’ll need for this tutorial is an interesting, dynamic texture photo and a graphic to place over it. I’ll be using this nice, cracked wall photo and a cool, vintage bear logo.

giftorial


giftorial


If you’re using your own images, some of the settings below might need to be tweaked slightly, but the overall process should be the same. Let’s get started!


1. Open The Wall Image


Start by opening the wall photo in Photoshop.


giftorial


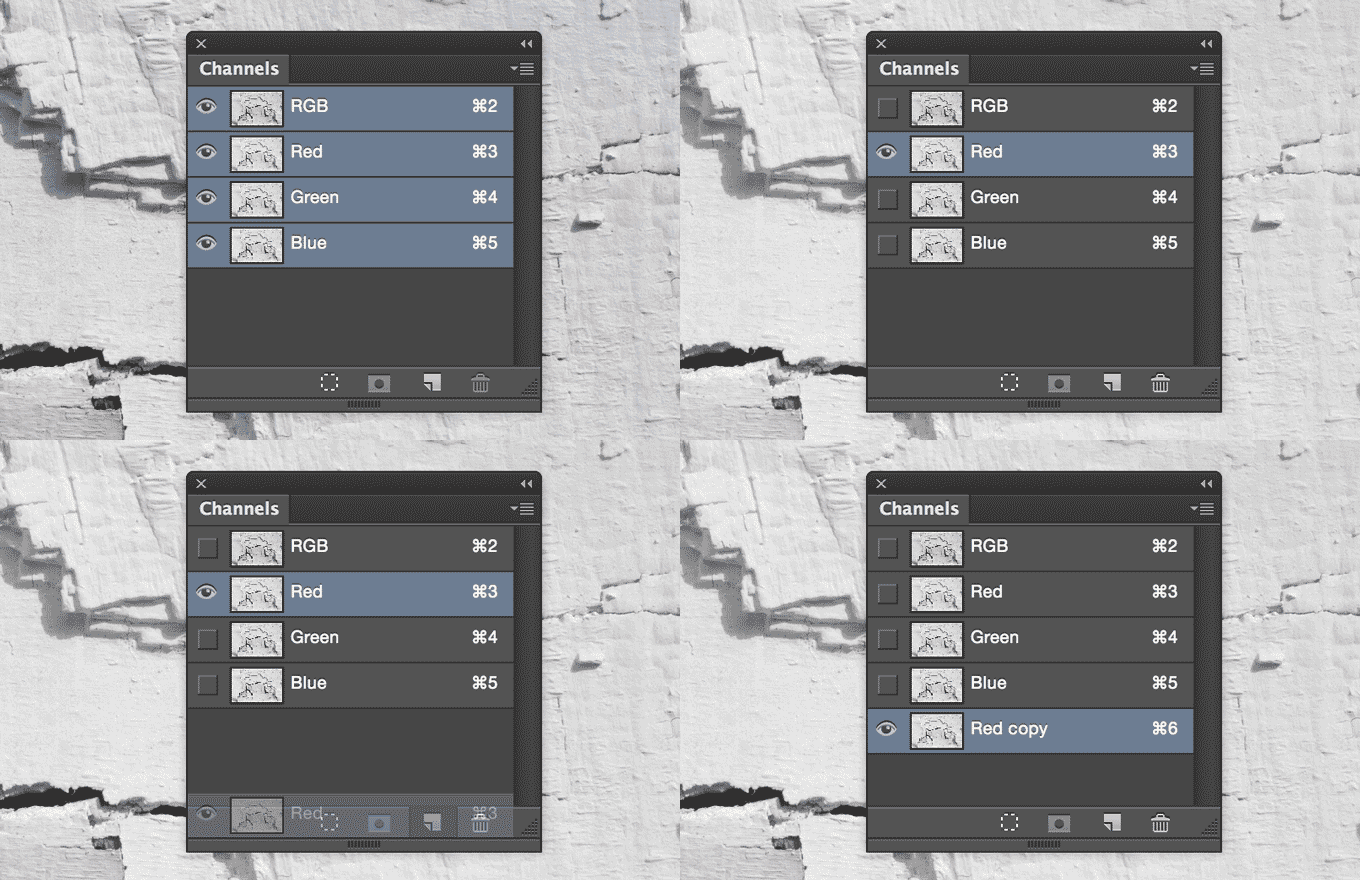
2. Copy The Red Channel


Next, go to your Channels panel and copy the Red channel. I simply chose the red one because it had nice contrast, your experience may vary.

giftorial


Note that this step is a bit redundant with step 4, I simply like to copy my channels before messing with them too much just to be on the safe side.


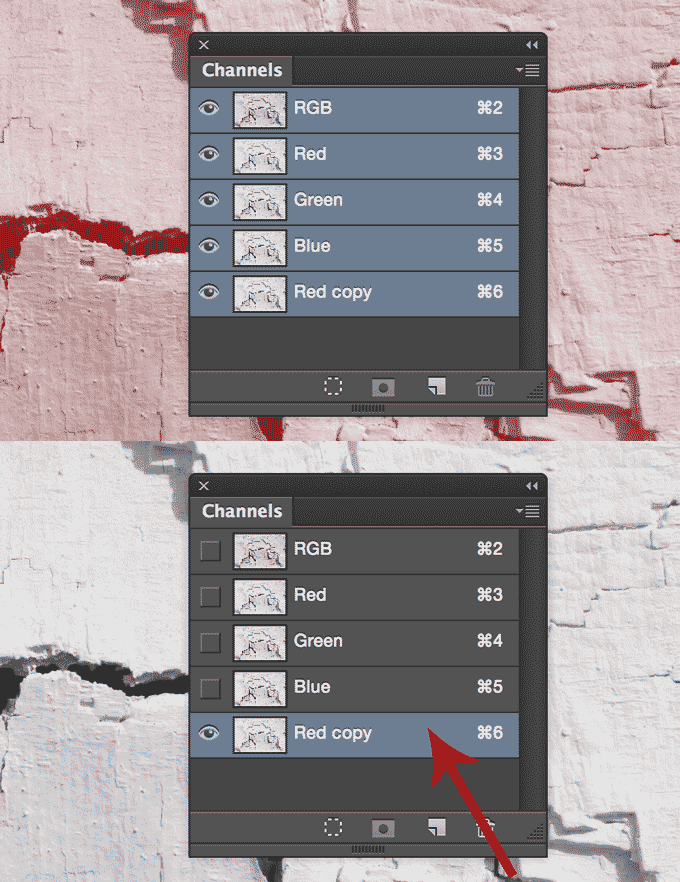
3. Turn Off All Channels Except the Red Copy


Now, make sure the only visible channel is your new copy. To do this, turn off the eye icons next to the others (typically, clicking a channel should also make it the only visible layer).

giftorial


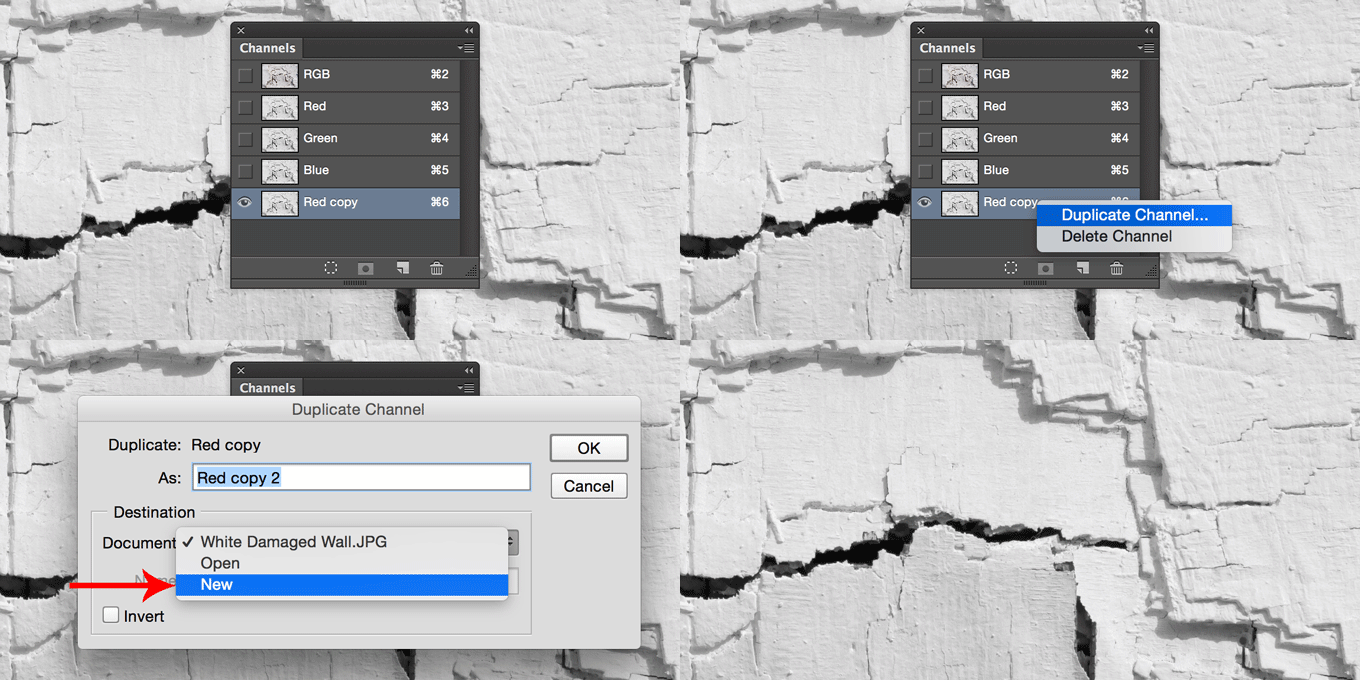
4. Create a New Document From The Red Channel


Right-click on your new channel and choose Duplicate Channel. You’ll want to choose New Document in the dropdown of the window that pops up, then click OK.

giftorial


This will create a brand new file out of our red channel copy. This new file will serve as the input pixel data for our displacement map.


5. Increase Contrast in New Document


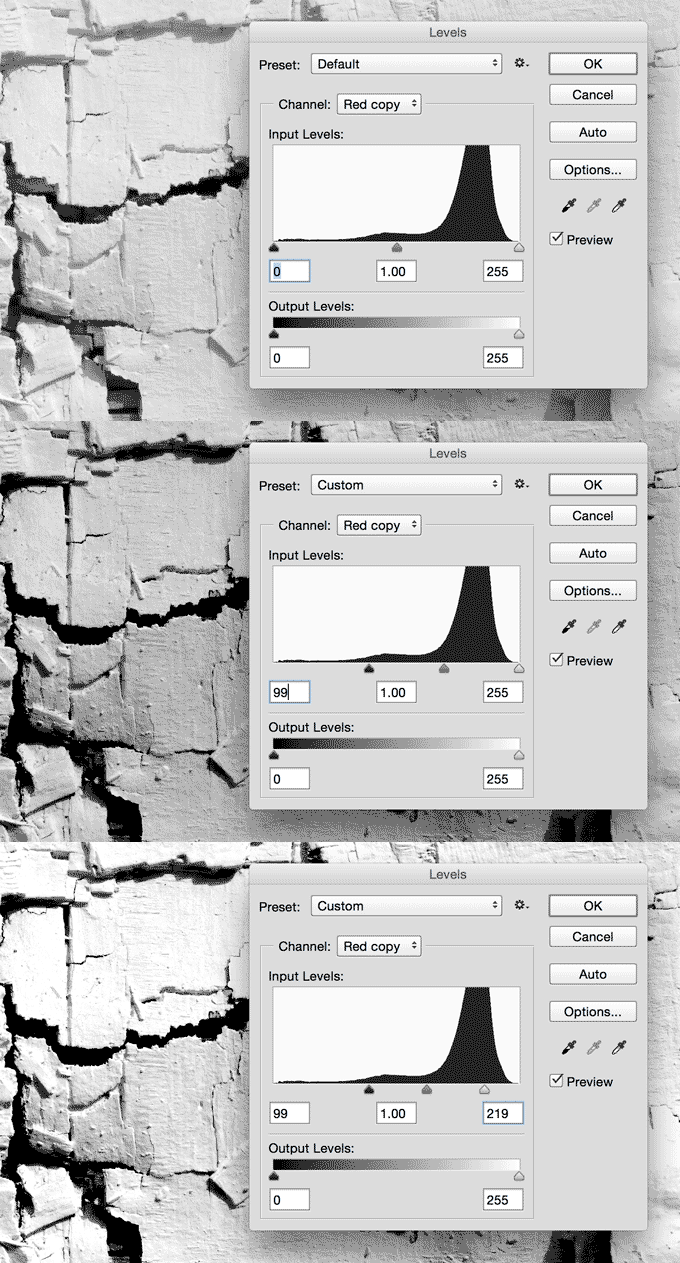
Displacement maps use highlights and shadows from grayscale documents to determine where the highs and lows will be in your distortion. Rather overthink how this works, we can simply use our background as our input and it will shape our distortion in a way that seems realistic.


Before we do this though, let’s ramp up the contrast in our new document a bit with a Levels adjustment.

giftorial


6. Blur New Document


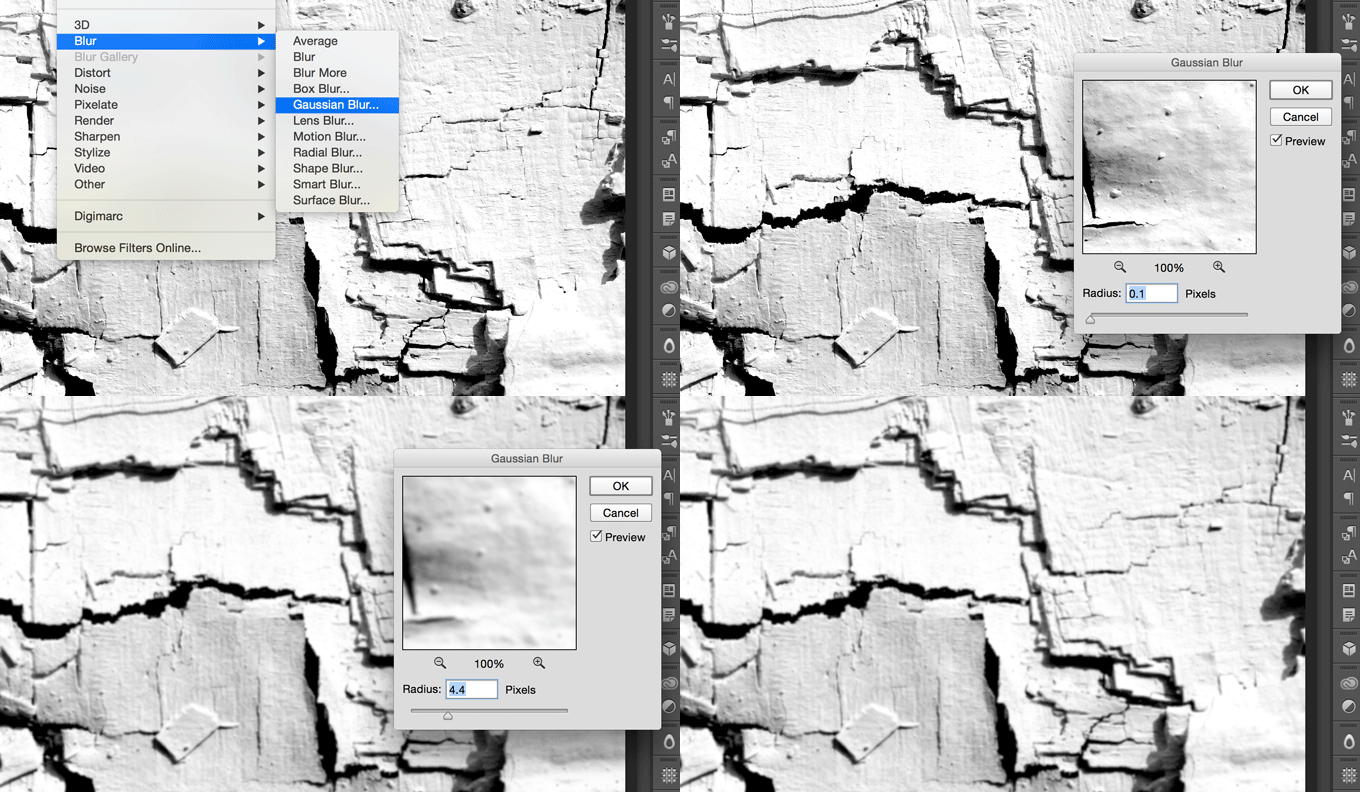
Next, you’ll want to add a slight Gaussian Blur. This will help make sure the effect isn’t too harsh. How much you should blur greatly depends on the size and resolution of your document. For mine, a 4.4px blur worked great.

giftorial


7. Save the Blurred File as a Separate PSD


Save this newly blurred PSD to your project folder as DisplacementMap.psd, then switch back to your original wall photo, making sure to turn off any extra channels you created earlier. You want just the wall photo in its original form:


giftorial


8. Paste In Graphic as Smart Object


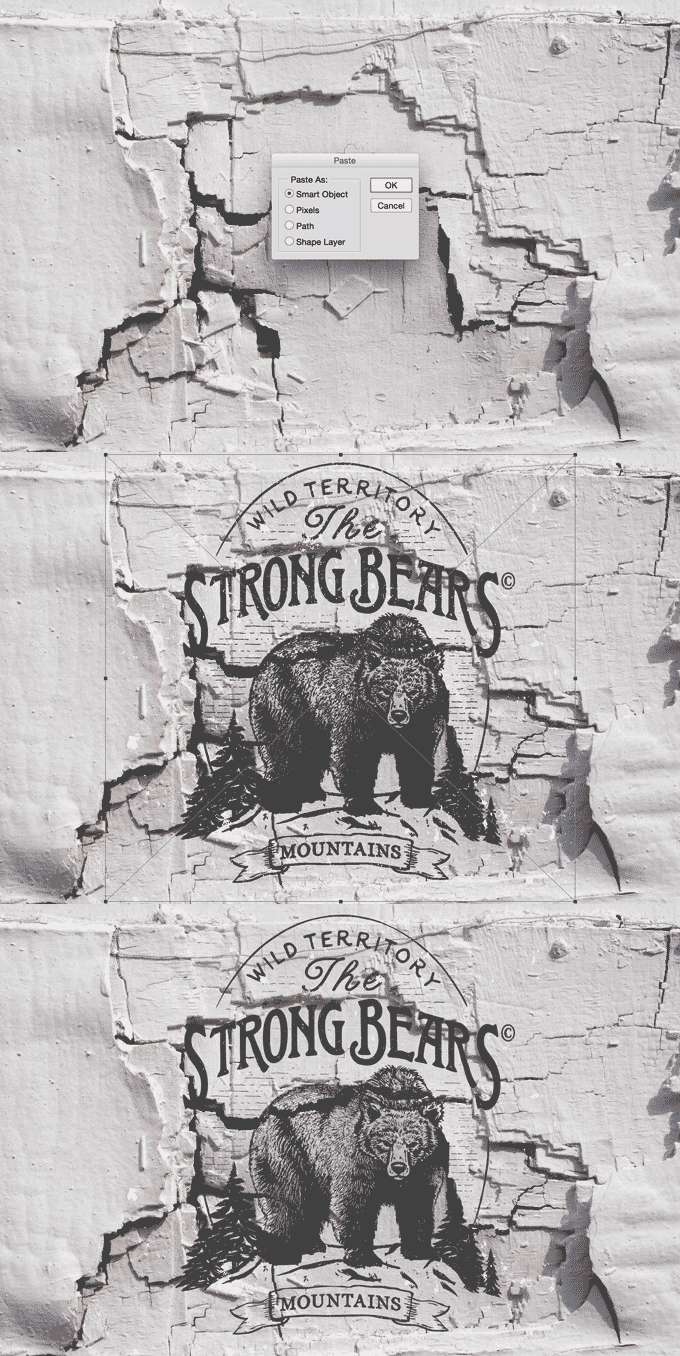
In Illustrator, copy the graphic that you’re going to be applying to the textured wall. Then, paste it on top of the wall in Photoshop. Make sure to select Smart Object in the Paste dialog. Position the graphic however you like.

giftorial


8. Set Graphic to Linear Burn, Fill 65%


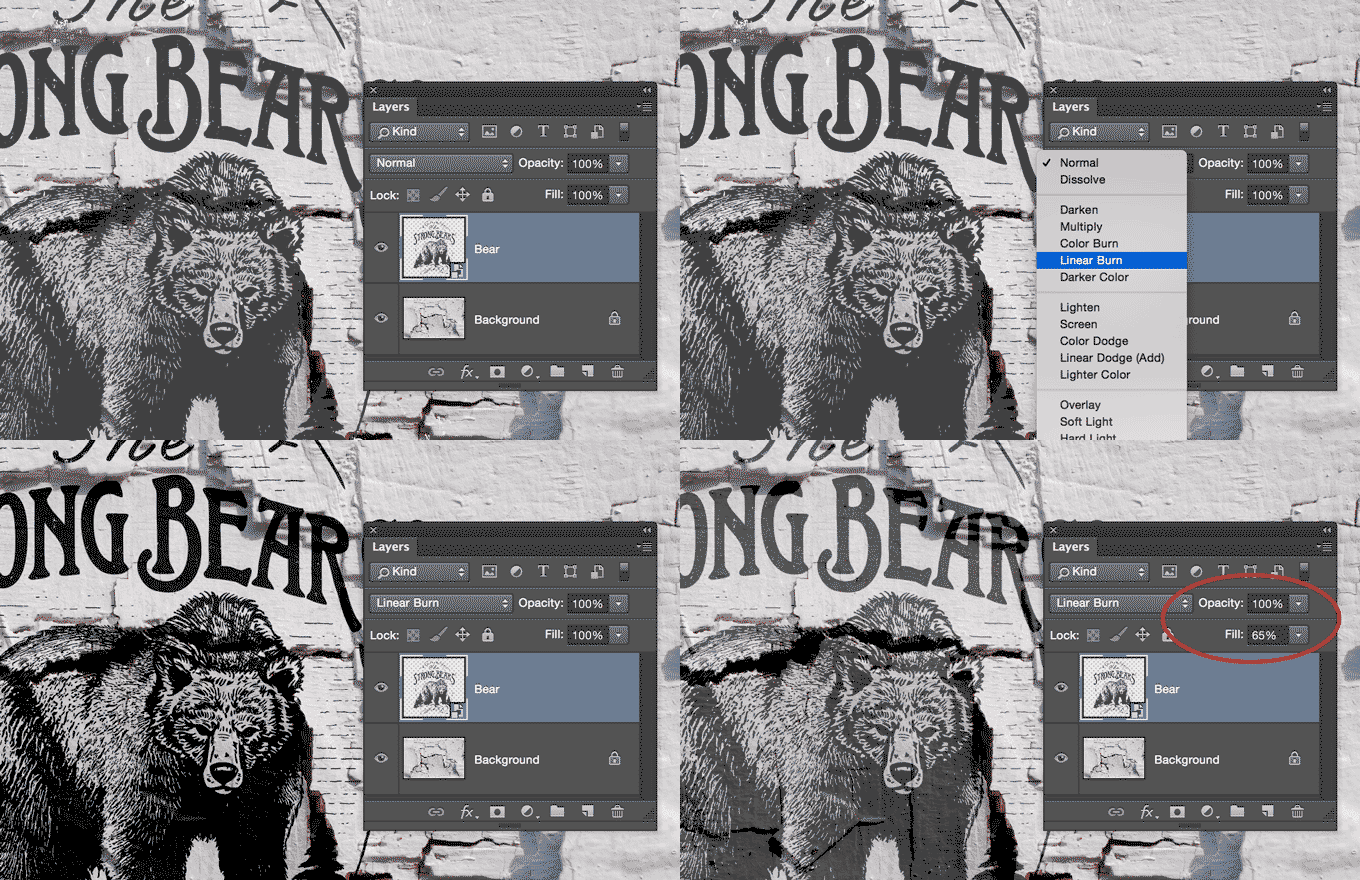
To make sure the graphic is blending nicely, set it to Linear Burn. Then, drop the fill to 65%.

giftorial


Note that, with my light background and dark graphic, I can use blending modes like Multiply, Color Burn, and Linear Burn. If your background is dark and your graphic is light, try Screen or Overlay.


9. Apply Displacement Map


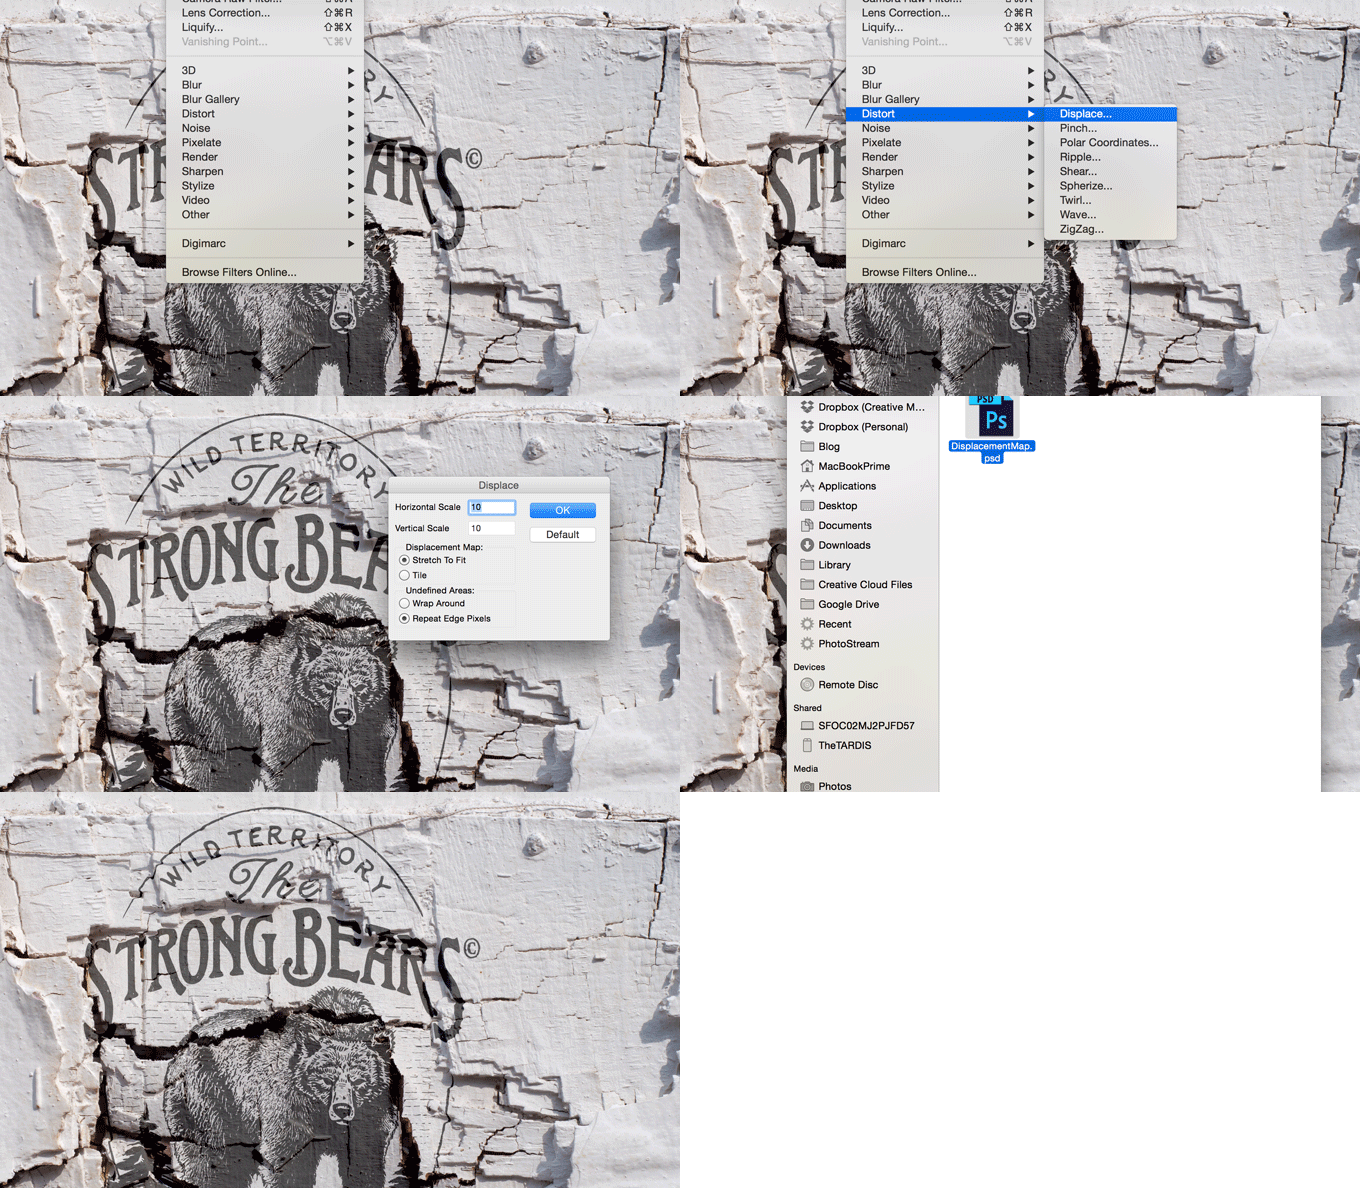
Now we’re ready to distort the image. Go to Filter>Distort>Displace. In the dialog that pops up, the default options were just fine for me, but you may need to tweak them for your project.

giftorial


As you can see in the GIF above, the Displace dialog wants you to select a file. Simply select DisplacementMap.psd from before (the blurry one).


10. Admire The Results


That’s it! Your graphic should now be convincingly distorted to your background. Really zoom in and admire all the details. Imagine how long each little nudge would’ve taken you with the Liquify tool!


giftorial


giftorial


Tweak Where Necessary


Note that our results are impressive, but not perfect. For instance, some of the shadows in the image that shouldn’t distort the graphic, do. Depending on how detailed you want to get, you can spend a long time tweaking to make sure everything is perfect. For most uses though, I’m pretty happy with the effect that result from the simple steps above.


giftorial


getpaidtowrite-banner
GIFtorial: How To Use Displacement Maps in Photoshop